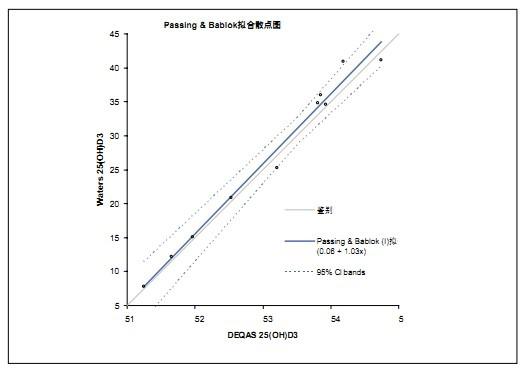
Lisa J Calton, Scott D Gillingwater, Gareth W Hammond, Donald P Cooper Introduction Figure 1. System Configuration for Waters ACQUITY UPLC/TQD experiment LC condition MS condition Calibrators and QC standards Sample Preparation Ion suppression Result linear Figure 2. Calibration curve for 25OHD3 in serum. Figure 3. Calibration curve for 25(OH)D2 in serum. Accuracy <br> The accuracy of the analytical method was examined by analyzing external quality control samples purchased from DEQAS (). A zero-crossing calibration curve was drawn using the Chromsystem single-point calibrator to calculate the DEQAS sample concentration. The results of Waters 25OHD3 were compared to the average of the results obtained by the DEQAS LC/MS method using Passing-Bablok linear regression (Microsoft Office Excel 2003 with Analyse-It plug-in version 1.73). All results were within ±11.5% of the expected value (Figure 4). Figure 4. Passing-Bablok linear regression analysis comparing the Waters 25OHD3 results with the average of the results obtained by the DEQAS LC/MS method. Precision Sensitivity Figure 5. The chromatogram shows the signal-to-noise ratio measurements for the lowest concentration calibrator and individual analytes. Ion suppression A stable isotope-labeled internal standard is used to compensate for the observed differences in matrix effects between individual analytes 5 . discuss Conclusions The method for the analysis of 25OHD2 and 25OHD3 in serum developed in this paper has good linearity, sensitivity and precision. This method provides more reliable results than conventional immunoassays. UPLC/MS/MS is able to accurately and reliably determine 250HD2 and 250HD3 in serum to prevent false positives in the overall concentration of vitamin D in patients receiving D2 supplementation. references
We supply various kinds of peptide including peptide from plants and from animals. Peptide is a kind of Nutritional supplemet for people. Different protein peptides are rich in different nutrients. People can choose suitable protein peptides according to their own body needs. As a kind of nutritionally safe health food, protein peptide plays an important role in improving people's health.
Antioxidation,Regulation of immune function,Contribute to skin care,Delay skin aging and make it whiten,Inhibit the growth of tumor,Hypoglycemic and hypolipidemic,Reduce blood pressure,Inhibit cancer cells,Assisting in decreasing blood glucose,Reduce blood fat, inhibit cholesterol etc.
Quinoa peptide,Ginseng Oligopeptide,Walnut peptide,Wheat protein peptide Allied Extracts Solutions , https://www.alliedbiosolutions.com
Waters Corporation Clinical Business Unit (Atlas Business Park, Manchester, UK)
Clinical studies have shown that vitamin D deficiency is very common in adults and children in many parts of the world. In addition to well-known effects (such as rickets, osteoporosis, and osteomalacia associated with calcium dysfunction), there is now growing evidence that vitamin D deficiency increases the risk of certain cancers, and many Other diseases have a certain impact 1,2 . Vitamin D has two forms of existence, one is vitamin D 3 (D3) produced by skin exposure to sunlight, and the other is plant derivative - vitamin D 2 (D2) present in various supplements. Vitamin D is metabolized in the liver to form 25-hydroxyvitamin D [25OHD], which is further metabolized in the kidney to form the active metabolite 1,25-dihydroxyvitamin D. The level of 25OHD is considered to be the best clinical indicator for assessing vitamin D levels in the body 3 . Assessment of vitamin D levels is important for the diagnosis of vitamin D deficiency and monitoring of complementary therapies. Recently, quantitative analysis of 25OHD2 and 25OHD3 by LC/MS/MS methods has been favored by other methods such as competitive binding detection, immunoassay and HPLC. The main problem with immunoassay is the inability to distinguish between 25OHD2 and 25OHD3, as well as the cross-reactivity of antibodies with 25OHD2 to determine the total concentration of 25OHD. If the cross-reactivity is less than 100%, then D2 may not be accurate monitoring of therapy 4. 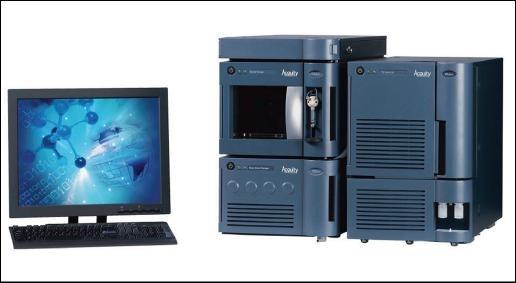
The Waters® ACQUITY® Series Quadrupole Detector (TQD) was used in conjunction with ACQUITY UPLC® for each analysis. The complete system configuration is shown in Figure 1. By running the instrument at the electrical MassLynx® 4.1 software spray positive ion mode, and using application software QuanLynx TM automatic data processing. The cone voltage is optimized to maximize the abundance of the parent ions entering the ion source, and the corresponding parent ions are selected into the collision cell by the first quadrupole. The argon gas and the collision energy are used to induce collision-induced dissociation to generate characteristic product ions. Specific multiplex reaction monitoring (MRM) was established using this method. The experiment is shown in Table 1.
LC System: Waters ACQUITY UPLC System Column: ACQUITY UPLC BEH C 8 , 2.1 x 50mm, 1.7μm
Column temperature: 45 ÌŠC
Flow rate: 400μL/min
Mobile phase A: 2 mM ammonium acetate + 0.1% formic acid in aqueous phase Mobile phase B: 2 mM ammonium acetate + 0.1% formic acid in methanol gradient: Mobile phase B was maintained at 73% for 2 min and increased from 73% in 1.5 min to 98%
MS System: Waters ACQUITY TQD
Ionization mode: ESI+
Capillary voltage: 2.5kV
Taper hole voltage: 24V
Desolvation gas temperature: 400 ÌŠC
Desolvent gas flow: 900L/h
Source temperature: 120 ÌŠC
Collision gas flow rate: 7.10 x 10 -3 mbar 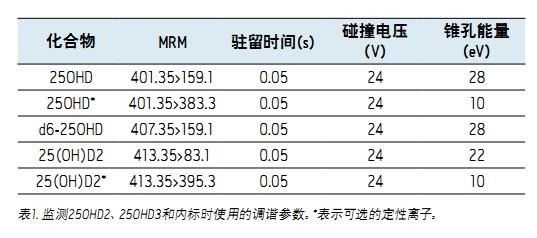
A single concentration of calibrator and a dual concentration level of QC standard (Chromsystem, Munich, Germany) was prepared according to the manufacturer's instructions. A low concentration QC standard solution was prepared by mixing human serum and adding known concentrations of 25OHD2 and 25OHD3. The final concentrations of 25OHD2 in low, medium and high concentration QC samples were 19, 27 and 84 ng/mL, respectively, and the final concentrations of 25OHD3 were 13, 29 and 89 ng/mL, respectively. Calibrators were prepared using mammalian serum for linear evaluation, with concentrations of 25OHD2 and 25OHD3 ranging from 1-100 ng/mL. The stock solution was tested at 264 nm and then adjusted to the final concentration.
Serum (150 μL) was pipetted into a 2 mL microcentrifuge tube (Anachem), 10 μL of internal standard (250 ng/mL hexafluoro 25OHD3, AS was synthesized, 80% methanol/20% IPA was used as solvent), and vortexed (10 s). A 0.2 M ZnSO 4 solution (150 μL) was added and vortexed (10 s) to enhance the reaction. Methanol (300 μL) was added and mixed (10 s) to precipitate the protein present in the serum. Hexane (750 μL) was added to extract 25OHD. Mix for 30 s and then centrifuge the sample at 13,000 rpm for 5 min. The hexane layer was removed and placed in a Waters largest recovery vial and evaporated to dryness under nitrogen at 50 °C. The sample was reconstituted in 75 μL of 70% aqueous methanol, and 20 μL of the sample was injected into the UPLC/MS/MS system with the preload function of the ACQUITY Sample Manager at an injection interval of 6 min.
Human serum samples were mixed with low concentrations of 25OHD2 and 25OHD3 and analyzed using post-column additions, passing through the ACQUITY TQD integrated sample flow path at a concentration of 100 ng/mL and a flow rate of 10 μL/min.
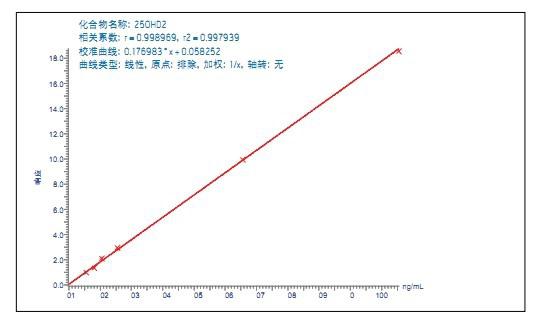
Use QuanLynx ApexTrack TM quantitation software and data processing integration algorithm. The linearity of the analytical method was investigated by adding known concentrations of 25OHD2 and 25OHD3 to the serum at a concentration ranging from 2.5 to 100 ng/mL. The determination coefficient of 25OHD3 (R2) > 0.999 (Fig. 2), the calculated calibrator concentration is within ±4% of the specified value. The determination coefficient of 25OHD2 (R2) >0.997 (Fig. 3), the calculated calibrator concentration is within ±10% of the specified value. 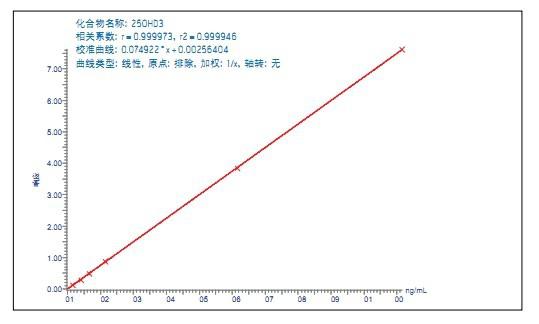
Intra-assay accuracy was determined by extracting low, medium, and high concentrations of QC samples and repeating the analysis 5 times. The coefficient of variation (CV) of 25OHD was calculated from these three concentration levels. The low, medium and high concentrations of QC samples were analyzed for 5 consecutive days to determine inter-assay accuracy. The results are shown in Table 2. 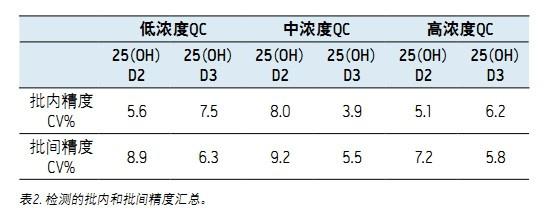
The chromatogram of the lowest concentration internal serum calibrator obtained is shown in Figure 5. Each chromatogram is labeled with the compound name, peak-to-peak signal-to-noise ratio (SNR), and concentration. All responses were above the detection limit (SNR 5:1), so this method can detect vitamin D levels (<6 ng/mL) in patients with severe vitamin D deficiency. 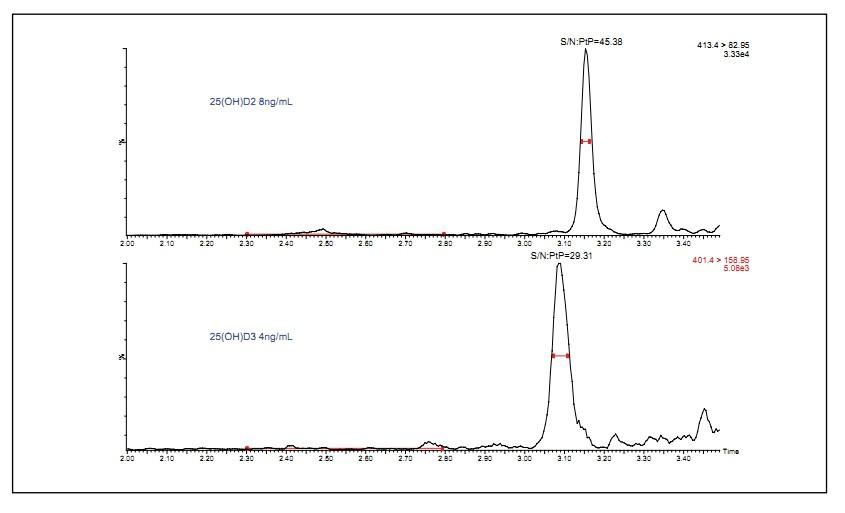
Ion inhibition studies indicate that 25OHD3 partially elutes in the ion suppression region, as shown in Figure 6. 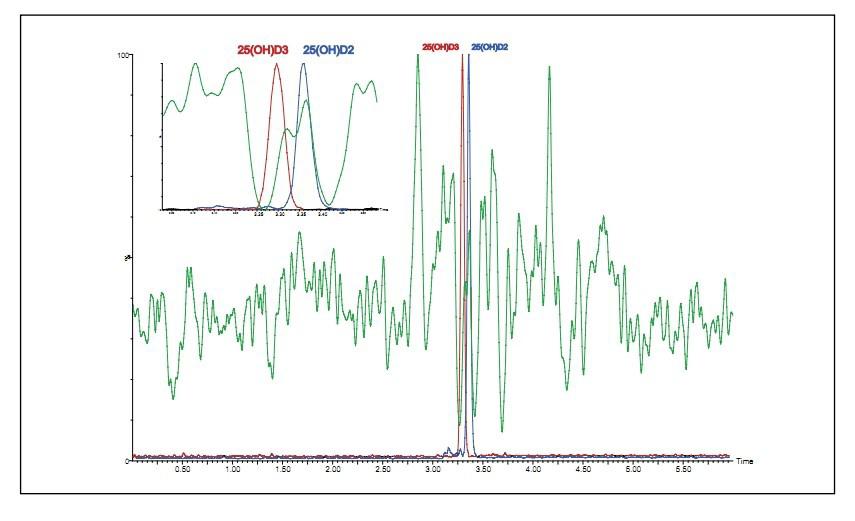
Figure 6. 25OHD ion inhibition analysis showing the elution analysis results for 25OHD2 and 25OHD3 in an enlarged view.
A method for the analysis of 25OHD2 and 25OHD3 in serum using UPLC/MS/MS was developed in this paper. The method performs quantitative detection of individual analytes by performing liquid-liquid extraction from serum and using qualitative and quantitative ions. In addition, the reliability of accurately identifying analytes is improved by monitoring the qualifier ion ratio. The measurement results show that the method has good sensitivity and intra- and inter-assay precision. With this method, up to 100 samples can be analyzed daily.
1. Gorham ED, Garland CF, Garland FC, Grant WB, Mohr SB, Lipkin M, et al. Optimal vitamin D status for colorectal cancer prevention: a quantitative meta-analysis. Am J Prev Med 2007;32:210–6.
2. Garland CF, Gorham ED, Mohr SB, Grant WB, Giovannucci EL, Lipkin M, et al. Vitamin D and prevention of breast cancer: pooled analysis. J Steroid Biochem Mol Biol 2007;103:708–11.
3. Standing Committee on the Scientific Evaluation of Dietary Reference Intakes Institute of Medicine. DRI Dietary Reference Intakes for calcium phosphorus, magnesium, vitamin D and fluoride. National Academy Press, Washington, DC;
4. Hollis B. Editorial: The Determination of Circulating 25-Hydroxyvitamin D: No Easy Task. J Clin Endocrinol Metab, July 2004, 89(7): 3149–3151.
5. Viswanathan CT. et al. Quantitative Bioanalytical Methods Validation and Implementation: Best Practices for Chromatographic and Ligand Binding Assays. Pharmaceutical Research 2007;24(10):1962-1973.